Profiling
If you’re curious about performance of any page, you can turn on profiling and get a detailed report of what’s happening. This is a useful thing to do before a site goes live.To turn on profiling, open your Welcome controller in an editor, and make the following change to the constructor:

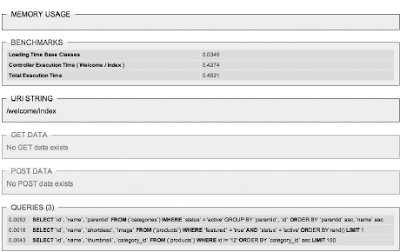
Now visit the home page and scroll down. You should see a table giving details on how your application performed. You’ll see entries for controller load time, queries run, and other data. It should look something like Figure.

Compressing Output
One obvious way to speed up your home page is to turn on output compression. Doing so enables Gzip output compression for faster page loads. All you have to do is set $config[‘compress_output’] to TRUE in config.php, and CodeIgniter will test to see if the server its on supports Gzip compression. If so, then the server will use Gzip to speed things up.
There are two important things to keep in mind, however. Since not all browsers support Gzip compression, it will be ignored by those that can’t handle it. Don’t fret about this, though, because it is only the really old browsers that don’t use HTTP/1.1 or understand the Accept-Encoding header. Here’s a partial list of non-GZIP browsers:
❑ Netscape Navigator 3
❑ Netscape Communicator 4 (but only those before 4.06, and with errors after that version)
❑ Mozilla 0.9 (unless the user manually configures the browser to accept)
❑ Internet Explore 3.x and below
❑ Opera 3.5 and below
❑ Lynx 2.5 and below (some use separate Gzip command lines)
You might look at that list and think to yourself, “Isn’t it time for people to upgrade?” You’d be amazed at how long people hang on to their favorite browser. One more thing about compressing: If you have any white space at the end of your scripts, you’ll start serving blank pages. Make sure that you keep the ends of your scripts tidy.
Caching
CodeIgniter ’s caching engine allows you to take dynamically created pages and save them in their fully rendered states on the server, then reuse those fully rendered pages for a specific amount of time. For example, the first time a user hits a query-intensive page, the page is cached for X amount of time, and
all other visitors use the cached page until the cache expires.
Where are pages cached? Good question. They are written to the /system/cache folder that sits above your application. With high-traffic web sites, caching can give you huge boosts in performance in a short amount of time.
To put in caching, all you need to do is set a caching value for any controller function using the following command:

where X is the number of minutes you want the cache to remain active before it is deleted and reset.That’s it — there’s nothing else to load or configure because caching is part of the Output class and is therefore ready to be used in your application.
Turning Off Profiling
It is time to turn off profiling, as you don’t need it anymore. Simply erase the line from your controller,or set the profiler to FALSE.
Benchmarking
The Benchmark class can be used to mark start and end points in your code and to print out how much time (or how many resources) was used by that code. Benchmarking can be used in controllers, views, and models and are a great way to dig deeply into a performance-based problem.
To start off, open up your footer view (/system/application/views/footer.php), and add the following code to the file:

The elapsed_time() function will tell you how much time it took to render a page, from CodeIgniter framework initialization all the way through final output to the browser. The memory_usage() function will tell you how much memory was used.
Once you’ve loaded the view onto your site, visit one of the category pages. Remember, the home page is cached, so it’s better to visit an uncached page. You should see something like Figure.

According to the benchmarking functions, it took 0.07 seconds (give or take) to render the page, and it used 0 memory. (It could also be showing zero because your copy of PHP didn’t have --enable-memory- limit when it was compiled on the server. If that’s the case, and you want to show this kind of data, you will need to recompile PHP with the --enable-memory-limit flag set. In other words, having to reinstall PHP may or may not be worth your time, depending on the kind of visibility you want on profiling.) This kind of information is good, but what if you were trying to diagnose a more specific problem, like how long a specific query was taking? You could, for example, put the following markers down in your function:

Then, in your footer view, you could use elapsed_time() to print out the results:

According to this example, the getCategory() model function is taking a total of 3/1,000-ths of a second to run.
No comments:
Post a Comment